· 12 min read
Cloudflare D1 RowsRead Limit: 15k Rowsto Return 58Near the Cloudflare D1 rows read limit on a tiny app? One query read 15,000 rows to return 58. Two indexes cut daily reads from 4.48M to 0.82M.
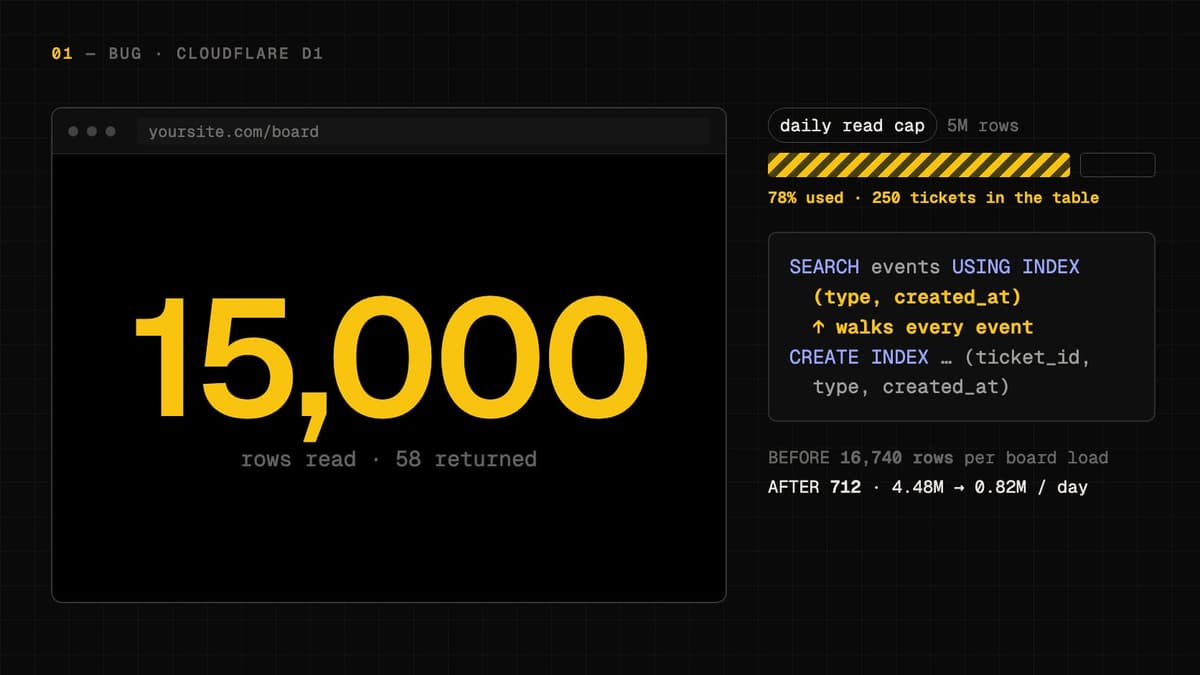
Cloudflare sent an email saying a D1 database had used 78% of its daily operation limit. The database belonged to a small internal ticketing app on Cloudflare Workers + D1. It had 250 tickets, 2,681 events and 1,196 attachments. It got about 18,000 read queries a day with little traffic. Nothing about that should come near the Cloudflare D1 rows read limit of 5 million rows a day on the Workers Free plan.
The cause was a list query that read about 15,000 rows to return 58. Three query plans had chosen the wrong index. This post shows how I found them with wrangler d1 insights and EXPLAIN QUERY PLAN, the two composite indexes that fixed two of them, and the one-character change that fixed the third. Measured on a copy of production data, the sixteen heaviest queries went from 4.48M rows read a day to 0.82M.
What the Cloudflare D1 rows read limit actually counts
The number to watch is rows read, and it counts rows the query visits, not rows it returns. Cloudflare's D1 pricing page says rows read "measure how many rows a query reads (scans), regardless of the size of each row." A query that walks 15,000 index entries to find 58 matches costs 15,000.
On Workers Free the daily allowances are:
| Meter | Workers Free | What happens at the cap |
|---|---|---|
| Rows read | 5 million / day | D1 queries return errors |
| Rows written | 100,000 / day | D1 queries return errors |
| Storage | 5 GB total | Inserts and schema changes fail |
The daily counters reset at 00:00 UTC. For a team on the free plan, 78% is a warning: one busier day, and every query in the app fails until midnight UTC. In this app that means the board and every ticket page stop working at the same moment. Staying under the cap matters more than the money, because on the free plan the cost of going over is an outage.
Tiny tables do not protect you. A few thousand rows are enough when the same bad plan runs once per row of a list, many times a day.
Find the expensive query in three commands
My first guess was the wrong one. The app polls for changes, so I blamed polling. The numbers said otherwise: 4,184 polling runs at 3 rows each came to about 0.07M rows a day. Two board-list queries, run 139 times, came to 2.1M. Measure before you guess.
Start at the database level. d1 info shows rows_read_24h for one database, so you know which database is spending the budget:
sh
npx wrangler d1 info tickets-db
Then rank the queries by total rows read over the last day. wrangler d1 insights is still marked experimental, but it gives you exactly what you need:
sh
npx wrangler d1 insights tickets-db --time-period 1d --sort-type sum --sort-by reads --limit 20 --json
For each query, multiply avgRowsRead by numberOfTimesRun. That product is its share of the daily budget. Then compare avgRowsRead with the number of rows the query should return. A query that returns one ticket and reads 1,690 rows is broken, however fast it feels.
Take the worst query text from that output and ask the remote database how it runs it:
sh
npx wrangler d1 execute tickets-db --remote --command "EXPLAIN QUERY PLAN SELECT * FROM attachments WHERE ticket_id IN (SELECT id FROM tickets WHERE project_id = 'p1') AND reply_id IS NULL"
If the plan names an index that is not the one keyed by the parent id, you have found the problem. All three plans below looked fine in code review. I only saw the problem in EXPLAIN output.
Three plans that chose the wrong index
The schema is ordinary. Each table had an index on its parent key, plus a few indexes added for other screens:
sql
CREATE TABLE tickets (id TEXT PRIMARY KEY, project_id TEXT NOT NULL, title TEXT, deleted_at INTEGER);
CREATE TABLE events (id TEXT PRIMARY KEY, ticket_id TEXT NOT NULL, type TEXT NOT NULL, body TEXT, created_at INTEGER NOT NULL);
CREATE TABLE attachments (id TEXT PRIMARY KEY, ticket_id TEXT NOT NULL, reply_id TEXT, url TEXT);

CREATE INDEX tickets_deleted_project_idx ON tickets (deleted_at, project_id);
CREATE INDEX events_ticket_idx ON events (ticket_id);
CREATE INDEX events_type_created_idx ON events (type, created_at);
CREATE INDEX attachments_ticket_idx ON attachments (ticket_id);
CREATE INDEX attachments_reply_idx ON attachments (reply_id);
I assumed events_ticket_idx and attachments_ticket_idx were in use because they existed. EXPLAIN showed they were not.
1. The correlated subquery that walks every status event
The board shows each ticket's latest status. That is a correlated subquery, run once per ticket in the list. The real query had three of them per row:
sql
EXPLAIN QUERY PLAN
SELECT t.id, t.title,
  (SELECT e.body FROM events e
    WHERE e.ticket_id = t.id AND e.type = 'status'
    ORDER BY e.created_at DESC LIMIT 1) AS last_status
FROM tickets t
WHERE t.project_id = ? AND t.deleted_at IS NULL;
text
QUERY PLAN
|--SEARCH t USING INDEX tickets_deleted_project_idx (deleted_at=? AND project_id=?)
`--CORRELATED SCALAR SUBQUERY 1
   `--SEARCH e USING INDEX events_type_created_idx (type=?)
The planner chose (type, created_at) because that index also satisfies the ORDER BY. It then walks every status event in the database, newest first, until one belongs to this ticket. For an old ticket that is most of the table, and it repeats for every row of the board. On the production copy, one last-status lookup read 493 rows to return 1.
2. The attachment lookup that reads every top-level attachment
sql
EXPLAIN QUERY PLAN
SELECT * FROM attachments
WHERE ticket_id IN (SELECT id FROM tickets WHERE project_id = ?)
  AND reply_id IS NULL;
text
QUERY PLAN
|--SEARCH attachments USING INDEX attachments_reply_idx (reply_id=?)
`--LIST SUBQUERY 1
   |--SCAN tickets
   `--CREATE BLOOM FILTER
reply_id IS NULL is an equality that the reply_id index can serve, so the planner used it. Almost every attachment is top-level, so "every row where reply_id is null" is nearly the whole table. Loading one ticket's attachments read 783 rows to return 4.
3. The primary-key load that reads every live ticket
sql
EXPLAIN QUERY PLAN
SELECT * FROM tickets
WHERE id IN (SELECT ticket_id FROM events WHERE id = ?)
  AND deleted_at IS NULL;
text
QUERY PLAN
|--SEARCH tickets USING INDEX tickets_deleted_project_idx (deleted_at=?)
`--LIST SUBQUERY 1
   |--SEARCH events USING INDEX sqlite_autoindex_events_1 (id=?)
   `--CREATE BLOOM FILTER
This one surprised me most. The planner skipped the primary key and used (deleted_at, project_id), so loading one ticket meant reading every live ticket. One ticket load read 1,690 rows to return 1.
There is a pattern here. In each case, a low-selectivity column (type, reply_id IS NULL, deleted_at IS NULL) offered an equality or a sort, and the planner preferred it to the per-ticket key. That is most likely when the subquery or IN (...) hides how few rows the parent key would match.
Shipping on Cloudflare's free plan and getting quota emails you can't explain? A plan like this looks fine in code review and only shows up on the bill or in an outage. Tell me about your stack and I'll find the query that is spending the budget.
Fix 1: widen the per-parent indexes
The fix for the first two plans is to make the parent-key index win on every count. Put the parent key first, then the filter column, then the sort column. An index that matches ticket_id, type and the ORDER BY beats one that matches only type and the ORDER BY.
I kept the same index names and replaced them in one migration. The new indexes start with the same column as the old ones, so code that was already deployed keeps working during the rollout:
sql
DROP INDEX IF EXISTS events_ticket_idx;
CREATE INDEX events_ticket_idx ON events (ticket_id, type, created_at);

DROP INDEX IF EXISTS attachments_ticket_idx;
CREATE INDEX attachments_ticket_idx ON attachments (ticket_id, reply_id);
sh
npx wrangler d1 migrations apply tickets-db --remote
The plans after the migration:
text
`--CORRELATED SCALAR SUBQUERY 1
   `--SEARCH e USING INDEX events_ticket_idx (ticket_id=? AND type=?)
text
|--SEARCH attachments USING INDEX attachments_ticket_idx (ticket_id=? AND reply_id=?)
`--LIST SUBQUERY 1
   `--SCAN tickets
The subquery now jumps to one ticket's status events, which are already in created_at order, and stops after one row. The last-status lookup went from 493 rows read to 1.
Fix 2: the unary plus for the primary-key case
For the ticket load, a wider index is the wrong answer. The primary key is already the best index. The planner just needs to stop considering deleted_at as an index constraint. SQLite has a documented way to do that: put a unary + in front of the column.
sql
SELECT * FROM tickets
WHERE id IN (SELECT ticket_id FROM events WHERE id = ?)
  AND +deleted_at IS NULL;
text
QUERY PLAN
|--SEARCH tickets USING INDEX sqlite_autoindex_tickets_1 (id=?)
`--LIST SUBQUERY 1
   `--SEARCH events USING INDEX sqlite_autoindex_events_1 (id=?)
The SQLite query optimizer docs describe this in disqualifying WHERE clause terms using unary "+". The + generates no bytecode, but it stops the term from constraining an index. The same page warns that + removes type affinity, which can change how a comparison like +x = 5 behaves on a TEXT column. An IS NULL test does not depend on affinity, so it is safe here. SQLite calls this a workaround of last resort. Use it only where EXPLAIN proves the planner is wrong, and add a short comment next to it so nobody removes the + later.
If you build queries with Drizzle or another query builder, you may need a raw SQL fragment for that one condition.
Measure rows read offline before you deploy
I wanted the numbers before the migration reached production, not after. There is one problem: wrangler d1 execute --local does not print rows read. The local D1 binding does return them, in meta.rows_read, the same field the D1 result object returns in production.
First, copy production into a local database:
sh
npx wrangler d1 export tickets-db --remote --output prod.sql
npx wrangler d1 execute tickets-db --local --persist-to .d1-prod-copy --file prod-ordered.sql
prod-ordered.sql is the same dump in a different order: all CREATE TABLE statements first, then the INSERT statements, then the CREATE INDEX statements. Imported in the original order, it failed on no such table.
Then run the real query text through getPlatformProxy and read meta.rows_read:
js
import { getPlatformProxy } from "wrangler";

const { env, dispose } = await getPlatformProxy({
  configPath: "./wrangler.jsonc",
  // --persist-to writes its state under a v3 subfolder
  persist: { path: ".d1-prod-copy/v3" },
});

const { results, meta } = await env.DB
  .prepare("SELECT * FROM attachments WHERE ticket_id IN (?) AND reply_id IS NULL")
  .bind("t1")
  .all();

console.log({ returned: results.length, rowsRead: meta.rows_read });

await dispose();
Save it as measure.mjs and run node measure.mjs. On this app the local numbers matched production within about 10%. Apply the migration to the local copy, run the script again, and you have a before and after for the exact query text and parameters, with no deploy.
I tried building a Miniflare instance by hand with d1Persist first. It failed on option validation. getPlatformProxy reads your Wrangler config and sets up the binding the same way wrangler dev does, so use that.
The results
All numbers below are rows read for the same query text and parameters, measured on the production copy:
| Query | Before | After |
|---|---|---|
| Board list (project A) | 16,740 | 712 |
| Board list (project B) | 16,662 | 634 |
| Load one ticket | 1,690 | 9 |
| One ticket's attachments | 783 | 4 |
| Last-status lookup | 493 | 1 |
| 16 heaviest queries × daily runs | 4.48M / day | 0.82M / day |
To stop this from coming back, I added a regression test that runs on workerd. It sends the board queries through a DB.batch proxy and sums meta.rows_read. Without the migration the total is 1,515. With it, the total is under 40. If someone adds an index that the planner prefers to the per-ticket key, the test fails before anything reaches production.
In production, both plans now show SEARCH … USING INDEX on the per-ticket index with ticket_id=? AND …. One ticket's attachments read 4 rows, down from about 775.
A checklist for any D1 app on the free plan
- Budget rows visited, not queries. Query count does not affect billing. Rows scanned does.
- Rank with
d1 insights. Sort by total reads and compareavgRowsReadwith the rows the query returns. EXPLAINevery correlated subquery and everyIN (...)in a list query. Those run once per row, so a bad plan there multiplies.- Put the parent key first, then the filters, then the sort. A parent-key-only index loses to any index that also covers the
ORDER BYor another equality. - Use
+colonly whereEXPLAINproves the planner is wrong, and leave a comment saying why. - Measure with
meta.rows_readlocally, and keep one test that fails when rows read goes up.
The same lesson applies to other metered databases on free plans. A badly planned query costs the most when it runs on every request. I saw the same thing when a Neon database hit its limit on a low-traffic site, and when an uncached Next.js fetch kept hitting the CMS.
FAQ
What happens when D1 hits the daily rows read limit?
On Workers Free, queries through the Worker binding and the REST API return errors until the counter resets at 00:00 UTC. Your data is safe, but every page that reads from D1 fails until then. To avoid that, upgrade to Workers Paid or reduce rows read before you reach the cap.
Why is my D1 rows_read so high on a small table?
Usually because the plan visits far more rows than it returns. The common causes are a missing index, or an existing index the planner does not use because another index matches a sort or a low-selectivity equality better. EXPLAIN QUERY PLAN shows which index it picked.
Does wrangler d1 execute --local show rows read?
No. Use getPlatformProxy and read meta.rows_read from the result of .all() or .run(), as shown above.
Is polling expensive on D1?
Only if each poll reads many rows. Here, 4,184 polls at 3 rows each were about 0.07M rows a day. The two list queries cost 2.1M. Check d1 insights before you redesign your polling.
Need this checked on your app?
I build fast, animated Next.js sites and the small backends behind them. Part of that work is making sure a free-plan bill can't turn into an outage. See recent work, then tell me what you're shipping.
04 — Studio note
For agencies, studios and brands
Need this levelof execution?
05 — Related notes
Same tags · same craft
Continue the thread.
- 01Reduce Vercel Edge Requests: 97% Used at 30 Views a DayStudio note / 094 · 18 Nov 26How to reduce Vercel Edge Requests when the free 1M is nearly gone: on this site 97% came from my own Link prefetch, not bots. Fix with before/after numbers.11 min
- 02Vercel Blob Limits Reached? Why My Site Went Dark TwiceStudio note / 088 · 06 Oct 26Vercel Blob limits reached and every image returns 403? Find which Hobby meter tripped, why video and hotlinked images burn it, and the fix that held.11 min
- 03Website Not Loading in China? What It Actually IsEngineering note / 087 · 23 Jul 26A client's site "wouldn't load" in mainland China. It wasn't the Great Firewall. Here's how I actually diagnosed a website not loading in China — and the fix.11 min