· 11 min read
Reduce Vercel EdgeRequests: 97% Used at30 Views a DayHow to reduce Vercel Edge Requests when the free 1M is nearly gone: on this site 97% came from my own Link prefetch, not bots. Fix with before/after numbers.
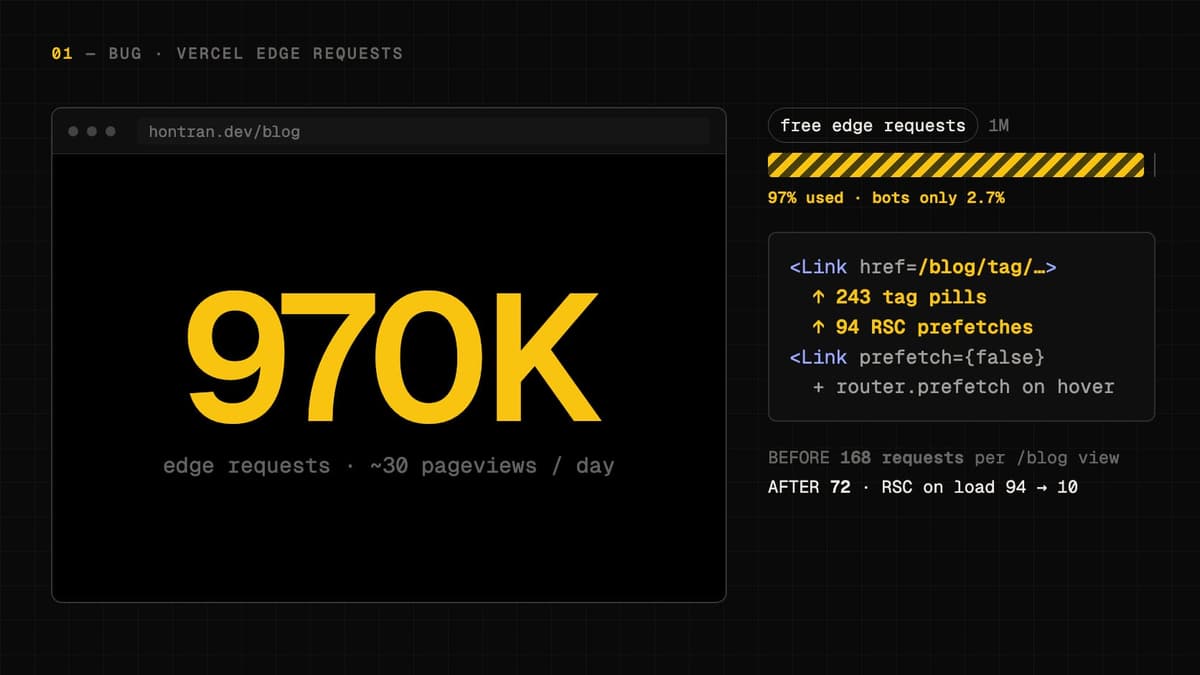
Vercel sent an email saying this site had used 75% of its included 1M Edge Requests. A little later the meter stood at 970K of 1M, or 97%. The site is hontran.dev, the one you are reading. GA4 said it got about 30 pageviews a day. Every page was prerendered, and curl -I came back with x-vercel-cache: HIT.
So who was making a million requests? Mostly my own code. The top route on the whole site was a tag archive that humans almost never open, and the requests came from Next.js <Link> prefetch on my blog list. Bots were 2.7% of the traffic. This post shows how to reduce Vercel Edge Requests the way I did it: find who makes the requests, count them per pageview on a real production build, and cut the ones nobody needs. The before and after numbers are at the end.
What counts as an Edge Request on Vercel
An Edge Request is any request that reaches Vercel's CDN. A cache HIT still counts. Vercel's CDN usage docs put it plainly: "Static assets and functions all incur CDN Requests." Vercel has since renamed the meter to CDN Requests. Its changelog says only the name changed, not how usage is counted or billed. The email I got still said Edge Requests, so that is the name I use here.
That explains why my earlier cache work did nothing for this meter. Static generation, revalidate: false and unstable_cache had cut Function Invocations, ISR Writes and database compute. They did not touch Edge Requests at all. Caching makes each request cheaper. It does not make the request go away.
So a Vercel quota alarm comes in two kinds:
| Question | Meters | What fixes it |
|---|---|---|
| Is each request expensive? | Function Invocations, ISR Writes, database compute | Caching |
| How many requests exist? | Edge Requests (now CDN Requests) | Making fewer requests |
On the Hobby plan, the current limits page lists the first 1,000,000 CDN Requests as included, and says that if you go over a Hobby limit you will in most cases have to wait until 30 days have passed before you can use the feature again. On a free plan, the cost of going over is downtime, not a bill.
Who is making the requests? Check bots before you blame them
My first guess was crawlers. I was wrong, and it took one look to prove it.
On Vercel, open the project's Observability and read two tabs:
- Routes shows which routes take the requests. On my site,
/blog/tag/[tag]was the number one route: 2.7K requests in 12 hours, 22% of everything, 100% cached. GA4 showed about 5 human views of tag pages in 28 days. - Bot Name shows what crawlers cost. All bots together came to 329 requests in 12 hours, which is 2.7%. AhrefsBot, SemrushBot and Bytespider did not show up at all.
Blocking bots would have saved almost nothing. Blocking them in middleware or the firewall would have saved nothing at all, because by then the request has already reached the edge and been counted. Only robots.txt stops a well-behaved crawler from making the request in the first place.
One warning about the Hobby dashboard. When I did this, the Paths tab showed sample data behind an "Upgrade to Pro" gate: rows like /api/demo and /api/generate, with counts larger than the project's own total. The Routes and Bot Name tabs were real, with 12 hours of data. Check that the numbers add up before you quote them.
If a tag archive nobody reads is your top route, the requests are not coming from people. They are coming from your own pages.
How Next.js Link prefetch multiplies requests
In the App Router, every <Link> that enters the viewport is prefetched in production. The Next.js Link docs say so, and also note that prefetching is only enabled in production.
What the docs do not tell you is how many requests that becomes. On Next 16, I counted 12 internal anchors on a page producing 19 ?_rsc= requests. Each link fires several segment-level RSC requests, each with a different _rsc hash, so the browser cannot dedupe them. The fan-out was about 4 to 5 requests per href, and a manual router.prefetch() pays it too. Budget per href, not per link.
Then look at what a blog list renders. Each card on my /blog page had a category pill and 3 tag pills. That added up to 243 tag anchors on one page. One view of /blog fired 94 RSC prefetches, and 58 of them went to tag and category archives that nobody reads. That is how a site with 30 pageviews a day made its tag archive the busiest route.
A rough rule: a taxonomy pill list costs about one request per pill per pageview.
The second amplifier was static files. Next.js serves files from public/ with Cache-Control: public, max-age=0, must-revalidate by default. Every navigation asks the CDN again for every image, font and model, and every one of those checks is an Edge Request. A repeat visit costs the same as the first.
Prefetch and these headers are two different multipliers. I can't tell you how much of the 970K each one caused. Both were fixed together, and both are measured below.
Running a Next.js marketing site on Vercel and seeing quota emails you can't explain? Tell me about the project. I'll check where the requests come from before anyone touches the plan.
Count the requests on a real production build
next dev disables prefetch, so a dev server proves nothing. Build and start the production server:
sh
next build && next start
Open a page, wait for it to settle, and paste this into the console. It groups every request the page made by path and counts the RSC prefetches:
js
const entries = performance.getEntriesByType('resource');
const byPath = {};
let rsc = 0;
for (const e of entries) {
  const url = new URL(e.name);
  if (url.searchParams.has('_rsc')) rsc++;
  byPath[url.pathname] = (byPath[url.pathname] || 0) + 1;
}
console.log({ total: entries.length, rsc });
console.table(Object.entries(byPath).sort((a, b) => b[1] - a[1]).slice(0, 20));
Run it once per page you care about, make one change, rebuild, and run it again on the same pages. That gives you an A/B on the same build, without guessing.
Fix 1: turn off prefetch on repeated and taxonomy links
Set prefetch={false} on every link that repeats across the site or points to a taxonomy page: tag and category pills, the footer menu, the mobile nav, CTA buttons and the logo. Keep prefetch only where a click is likely.
tsx
<Link href={`/blog/tag/${tag}`} prefetch={false}>
  {tag}
</Link>
Measured on the same production build, before and after:
- Homepage: 81 → 58 requests
/blog: 168 → 121 requests/blogRSC prefetches: 94 → 37
Fix 2: long cache headers for files in public/
In next.config, give files that never change in place a one-year immutable cache. This is close to what this site ships:
ts
async headers() {
  const immutable = [{ key: 'Cache-Control', value: 'public, max-age=31536000, immutable' }];
  const revalidating = [
    { key: 'Cache-Control', value: 'public, max-age=86400, stale-while-revalidate=2592000' },
  ];
  return [
    { source: '/images/:path*', headers: immutable },
    { source: '/fonts/:path*', headers: immutable },
    { source: '/icons/:path*', headers: immutable },
    { source: '/videos/:path*', headers: immutable },
    { source: '/audio/:path*', headers: immutable },
    { source: '/cms-thumbnails/:path*', headers: revalidating },
  ];
},
immutable means the browser never asks again, so when the art changes you must rename the file. Anything your CMS overwrites at the same path keeps the shorter max-age=86400 with stale-while-revalidate.
Fix 3: give prefetch back on intent
prefetch={false} has a cost. On Next 16 it also turns off hover prefetch (the docs say prefetching "will never happen both on entering the viewport and on hover"), and there is no "hover only" value. Navigation feels slower.
The better answer is to keep prefetch={false} and prefetch yourself when the user shows intent: mouse enter, keyboard focus, and touch start. Mobile has no hover, and touchstart fires about 100ms before the click. This is the hook this site uses:
ts
'use client';

import { useRouter } from 'next/navigation';
import { useCallback, useRef } from 'react';

export default function useHoverPrefetch(href: string) {
  const router = useRouter();
  const fired = useRef(false);

  const prefetch = useCallback(() => {
    if (fired.current || !href.startsWith('/')) return;
    fired.current = true;
    router.prefetch(href);
  }, [href, router]);

  return { onMouseEnter: prefetch, onFocus: prefetch, onTouchStart: prefetch };
}
The ref makes sure each href is prefetched once. Two practical limits: 'use client' applies to the whole file, so the hook cannot live in a server component, and a hook cannot be called inside .map(). Make one small client component that wraps <Link> and use it from every server module that renders these links:
tsx
'use client';

import Link from 'next/link';
import type { ReactNode } from 'react';

import useHoverPrefetch from '@/hooks/useHoverPrefetch';

export default function HoverPrefetchLink({ href, className, children }: {
  href: string;
  className?: string;
  children: ReactNode;
}) {
  const prefetchProps = useHoverPrefetch(href);
  return (
    <Link href={href} prefetch={false} className={className} {...prefetchProps}>
      {children}
    </Link>
  );
}
Now page load costs nothing, and you only pay for links someone actually reaches. Hovering one blog card fetches that one post and nothing else.
The results
Local A/B on the same production build, per view of /blog:
/blog | Requests | RSC prefetches on load |
|---|---|---|
| Before | 168 | 94 |
prefetch={false} on repeated links | 121 | 37 |
| Intent prefetch | 72 | 10 |
The fix went to production the same day, and curl confirmed the immutable headers were live.
Then, 14 days after the fix, Vercel sent the 75% email again. It was not a regression. The Hobby usage meter is a rolling 30-day window, not a monthly reset, so on that day it still held 16 days from before the fix. I pulled the per-day series from Vercel's usage API (request_hit_count + request_miss_count): about 26K requests a day before the fix and about 18K a day after, a 32% drop. The meter goes down on its own as the old days roll out of the window. Read the daily series before you change code again.
One caveat: the API's total ran about 15% below the dashboard figure. Requests challenged by the firewall during bursts from one scanner subnet are the likely difference, but I have not verified that.
How to reduce Vercel Edge Requests: a checklist
- A cache HIT is still an Edge Request. Caching fixes expensive requests, not the number of them.
- Read Routes and Bot Name first. If bots are a few percent, blocking them saves nothing.
- Count on
next build && next start. Dev disables prefetch. - Budget prefetch per href. Each one fans out into several
_rscrequests. - Turn off prefetch on pills, menus, CTAs and logos. Bring it back on hover, focus and touch.
- Cache
public/files as immutable and rename them when they change. - After the fix, read the daily series. The 30-day window keeps old days for a while.
I hit the same kind of wall on another platform: a Cloudflare D1 query that read 15,000 rows to return 58. On Vercel itself, Vercel Blob limits blanked every image on this site twice, and an uncached Next.js fetch kept hitting the CMS on every request. Free-plan meters each count something different, so find out what yours counts first.
FAQ
What counts as an Edge Request on Vercel?
Every request that reaches Vercel's CDN, including cache HITs, static files and RSC prefetch requests. Vercel now calls the meter CDN Requests, and the way it is counted did not change.
Why are there so many _rsc requests in my Next.js app?
They are App Router prefetches. On Next 16 each link fires several segment-level RSC requests with different _rsc hashes. A page with many links in view, like a blog list with tag pills, can fire dozens of them on a single view.
Does prefetch={false} disable hover prefetch in Next 16?
Yes. The Next.js docs say prefetching then never happens, on entering the viewport or on hover. To keep fast navigation, call router.prefetch(href) yourself on mouse enter, focus and touch start.
Will blocking bots reduce Edge Requests?
Only if bots are a large share, which Vercel's Bot Name tab shows. On this site they were 2.7%. Blocking in middleware or the firewall does not help, because the request has already reached the edge and been counted.
What happens when a Vercel Hobby project goes over 1M Edge Requests?
Vercel's Hobby docs say that in most cases you have to wait until 30 days have passed before you can use the feature again. The usage meter is a rolling 30-day window, so it also falls slowly after a fix.
Want a second pair of eyes on your Vercel bill?
I build fast, animated Next.js sites. Part of that work is keeping a site well inside its plan limits, so a quota email stays a warning. See recent work, then tell me what you're shipping.
04 — Studio note
For agencies, studios and brands
Need this levelof execution?
05 — Related notes
Same tags · same craft
Continue the thread.
- 01Vercel Blob Limits Reached? Why My Site Went Dark TwiceStudio note / 088 · 06 Oct 26Vercel Blob limits reached and every image returns 403? Find which Hobby meter tripped, why video and hotlinked images burn it, and the fix that held.11 min
- 02Why Next.js Keeps Hitting Your CMS on Every RequestEngineering note / 038 · 09 Jul 26Why does Next.js keep hitting my CMS on every request? A first-hand fix for App Router's uncached fetch, force-dynamic refetching, and a runaway CMS bill.14 min
- 03Vercel Deploy Not Updating Content (Cache, Not Code)Engineering note / 081 · 11 Sep 26Vercel deploy not updating content? The build shipped fine — the cache outlived it. How to prove it in 30 seconds and the fix your developer owed you.12 min